インフォグラフィック動画メーカー
Give your figures and the story they tell: ClipOnIt stages them with giant numbers, bars and lists that animate at the pace of the voice.
Free: 3 videos a month with a watermark · 24 visual styles, plus your own
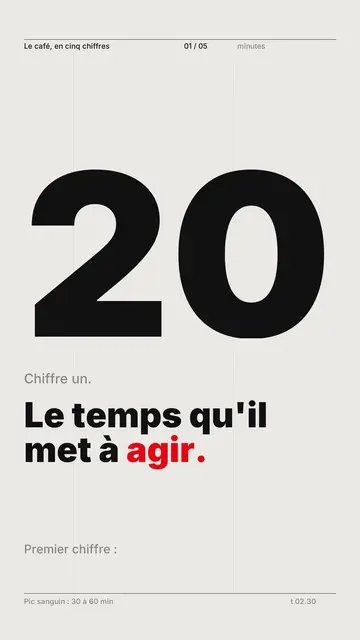
One data point, one scene
A static infographic shows everything at once; an animated one shows one data point at a time, in the order people understand it. ClipOnIt builds the video on that principle: each figure in your narration gets its own scene, and the number grows on screen as the voice says it.
Give sourced, rounded figures (“nearly a third” sticks better than 32.7%) and mention the source in the text. Swiss grid is the best style for data; Tech list fits rankings; Cutaway house helps when the numbers are about everyday life.
How to do it in 3 steps
- Write your figures
Three to five data points, with what they mean and the source.
- Pick the style
Swiss grid for data, Tech list for a top list, Cutaway house for everyday life.
- Check and export
Check every figure on screen, then render the MP4.
What people use it for
- Annual reportThe year's five key figures, in 40 seconds.
- Market studyWhat the data says about your sector.
- RankingA commented top 5 or top 10, from last to first.
- BudgetWhere the money of a household, a town or a project goes.
- ComparisonTwo countries, two offers, two eras, side by side.


A sample script
Figures from a town budget presented in 45 seconds, Swiss grid style. Each sentence carries a rounded figure and says what it means (an example written for this page, with made-up figures):
Out of 100 dollars of local taxes, where does your money go? 35 to schools. 20 to street maintenance. 15 to sport and culture. 12 to repay loans. The rest pays for town hall services. Schools remain, by far, the biggest item.
Mistakes to avoid
- Decimals everywhere“34.6%” is forgotten, “over a third” sticks. Keep the exact value for your post's caption.
- Figures with no comparisonA figure alone says nothing. “Twice as much as in 2020” or “as much as three stadiums” gives the scale.
- Forgetting the sourceSay where the data comes from in the narration. On LinkedIn especially, an infographic without a source loses credibility.
Length, fixes and limits
- Recommended length30 seconds for three figures, 45 to 60 for a top five. Allow four to six seconds per data point: time to see it grow and hear what it means. More than five figures? Keep the rest for a second video in the same style.
- Fine-tune with the AI DirectorThe Director (paid plans) adjusts how the data is staged: “a bar instead of the bare figure”, “reverse the ranking order”, “the key figure last”. The values themselves stay those in your text.
- LimitsNo spreadsheet import and no chart built from a file: figures go through the narration. Charts show readable proportions, not curves precise to the unit.
Frequently asked questions
Format, voice, pricing: the short answers.
Can I import a spreadsheet?
Not directly: write the figures in your text. Three to five data points per video give the best result.
Are the charts accurate?
The values come from your text. Check every figure on screen before rendering and fix it in the script if needed.
Can I cite a source?
Yes, put it in the narration; it shows up in the captions. Some news styles also display a credit on screen.
What about LinkedIn?
The vertical MP4 can be posted on LinkedIn, where it takes the full feed height on mobile.
How many figures per video?
Three to five. Beyond that, each figure gets less than two seconds on screen and the viewer remembers none of them.
Can I redo the same infographic every month?
Yes: save the video as a template with parameters for the figures, then produce the new version by changing only the month's values.
Is it free?
Yes, to start: the free plan gives 3 videos a month with a ClipOnIt watermark, in 8 styles (Pixel News, Press paper, Comedy cartoon, Class sketch, Night tale, Social screen, Retro synthwave, Flat vector), no credit card. Starter ($29/month): 15 watermark-free videos, all 24 styles plus your own, your own voice and the AI Director. Pro $49: 30 videos. Business $149: 100 videos and 3 seats.
Your video, in this style
Write one sentence: the style is already picked when you reach the editor.